Do you find the calculations interesting ? If yes, then try Neri calculator free for 1-day by clicking on the following link: Software Cooling-Tower.
Pages
Build and/or verify cooling tower performance and efficiency with TURBOsplash PAC ®™ and NERI Calculator
Labels
Comments on cooling tower
(1)
Cooling Tower Calculations
(28)
Cooling Towers
(18)
Cross-flow and Counter-flow
(25)
Energy
(37)
Environment
(35)
Evaporative Cooling Towers
(42)
Geothermal Energy
(5)
Heat Transfer
(15)
How to Design the Water Cooling Towers
(34)
How to Design Water Cooling Towers
(25)
NERI Calculator
(15)
Optimizing
(7)
Software cooling tower
(6)
TURBOsplash PAC ®™
(24)
Water
(27)
Water Cooling Tower
(28)
Water Cooling Towers
(4)
What happens inside TURBOsplash PAC
(6)
what happens inside TURBOsplashPAC ® TM
(7)
Why install TURBOsplash PAC ®™
(4)
Why install TURBOsplashPAC ® TM
(11)
Showing posts with label Cooling Tower Calculations. Show all posts
November 18, 2019
August 19, 2019
June 4, 2019
Cooling Tower: Relative Plan Area (RPA) and Relative Power Consumption (RPC) with respect to Relative Cooling Capacity (RCC)
The following graph illustrates the relationship between the Relative Plan Area (RPA) and Relative Power Consumption (RPC) with respect to increasing Relative Cooling Capacity (RCC), and describes how to double the relative cooling capacity with the same values of all other thermal and size conditions.
RCC
|
RPA
|
RPC
|
1
|
1.00
|
1.00
|
1.1
|
1.15
|
1.33
|
1.2
|
1.31
|
1.73
|
1.3
|
1.48
|
2.20
|
1.4
|
1.66
| |
1.5
|
1.84
|
3.38
|
1.6
|
2.02
|
4.10
|
1.7
|
2.22
|
4.91
|
1.8
|
2.41
|
5.83
|
1.9
|
2.62
|
6.86
|
2
|
2.83
|
8.00
|
In order to double the capacity (Relative Cooling Capacity) with the same values of all
other thermal and size conditions, the following must be done:
- Increase the surface of the tower by 2 ^ 1.5 times, that is, 2 (double) to the power of 1.5 = 2.83.
The tower must be 2.83 times bigger with the same fan, air flow capacity, etc.
OR:
- Increase the power to 2 ^ 3 times, that is, 2 (double) to the power of 3 = 8.
(verifying the speeds etc.)
References:
Comparative Evaluation of Different Packings
Péter Gosi, Institute far Electric Power Research (VEIKI), Budapest, Hungary
Judith Halasz, Universidade Estadual de Campinas, Sao Paulo, Brazil,
Pal Kostka
May 28, 2019
Experimental Calculation verified with CFD (Computational Fluid Dynamics)
Approximately 20 years ago, before the commercialization of TURBOsplash PAC ®™, the product underwent a rigorous experimental testing and a CDF evaluation aimed for design work.
Since the geometry of TURBOsplash PAC ®™ was not comparable to other existing filling materials, the purpose of the analysis was to carry out a quantitative / qualitative evaluation of the pressure drop and relative efficiency subject to fluids (water and air) inside the cooling tower. A practical evaluation method was used experimentally, performed by independent laboratories that specialize in these of tests. The evaluation parameters, detected experimentally, were analyzed and verified using CFD programs at universities, with the aim to build or verify all cooling towers.
Hence, it was possible to obtain the air pressure drop and efficiency curves in the flow rate air or/and water change.
Numerical Set-Up (need for CFD calculations)
- Stationary type simulation
- Turbulence model: k-ε
- Solved equation:
- Continuity
- Moment of the quantity of motion
- Turbulent kinetic energy - turbulent dissipation
Boundary conditions
- Inlet Velocity [FPM]: {150, 300, 400, 500, 600}
- Outlet static pressure: 0 [Pa] (relative to environmental pressure equal to 101325 Pa)
Experimental / Numeric Comparison
Numerically, it was possible to reproduce the experimental data as overall trend and in terms of absolute value of the air pressure drop.
Air Velocity
![]() |
March 25, 2019
The importance of water in the cooling tower industry - Water (part 9)
HOW TO MEASURE THE EFFICIENCY OF A COOLING TOWER
In the design process of a cooling tower, there is a need to have at least seven data values or rather 7 variables. If only one of these values is changed, the result will be a cooling tower with different dimensions.
Some of this data or design values are questionable, such as the temperature of the air at wet-bulb temperature, that seems to shift every year for speculation reasons.
To measure the efficiency of each tower, there is a need to know the exact design data and the theory that allows designing the tower, hence, knowing the values detected by lab effective testing.
All this will be treated in another chapter with interesting considerations.
Now we shall discuss how to evaluate the efficiency of the cooling tower in a simple and practical way.
We shall use the method that will allow, at least, to compare the efficiency of the tower at the any given time with the efficiency of the tower at the time it was installed: in other words, the degradation of efficiency (if it exists).
The main element for cooling water is air. The amount of air is essential for the amount of heat to dissipate, temperature, etc.
The amount of air measurement is synonymous of tower efficiency.
The degradation over time can decrease the amount of air in the tower because there are occlusions within the filling material that block the passage of air. Occlusions may originate from collapsed material, limestone, dust, algae, etc.
The water will always circulate.
The masses of water and air inside the tower are huge. The water weight is about 15,000 to 30,000 kg/m2 of the tower. Thus, the water will always fall via preferential routes: holes or by laminating on the tower walls. The amount of air passing through the tower is of vital importance.
A quick way to know the efficiency of the cooling tower is to measure the amount of air all you need to is to measure the speed of the air incoming to the tower or outgoing from the tower.
The speed in m/s and is measured with an anemometer (a very simple tool with fan). This tool is used to measure wind speed, etc. Hence, the speed through the cross-section (m2 top view) of the tower MUST be between 2.5 m/s and 4 m/s.
If the speed is lower than 2.5 m/s, the amount of air through the tower is very low and the cooling is compromised. The tower will be not efficient!
This method is basically a rule of thumb, but it serves as an alarm that a more accurate review is required.
February 25, 2019
Cooling Tower: How to calculate the quantity of evaporated water based only on thermal capacity?
This post is being updated!
Output Data
Legend:
A = Thermal Capacity (in TONS)
B = Thermal Capacity (in kW Thermal)
C = Water Evaporated (m3/hr)
D = Water Evaporated (l/s)
October 18, 2016
The importance of water in the cooling tower industry - Water (part 10)
WHAT ARE THE CONSEQUENCES OF A COOLING TOWER OPERATING AT LOW EFFICIENCY?
![]() |
Cooling tower detailed calculations |
A low efficient cooling tower brings very serious consequences.
Bruno Neri |
The tower is part of a system designed to dispose residual waste heat from the production plant or other primary system. The lower efficiency of the tower affects the performance of the primary plant with considerable waste of energy and, most of all, reduction or lack of production.
CONSTRUCTION OF A COOLING TOWER: TIPS ON ITS COMPONENTS AND THEIR USE.
As we saw, the cooling tower is an essential part of the plant system and, generally, it is separated from the primary plant system to which it drives.
The cooling tower is normally ignored until it goes into failure. Hence, the choice of components is of utmost importance.
Choose a tower made of stainless steel. Towers that need to be installed in heavy environments, such as chemical industries, choose polyester reinforced with glass fiber.
We have witnessed towers that have been operating for over 30 years, in these heavy environments, in perfectly stable structure.
Other useful tips and / or necessary will be exposed our next documentation work for publishing:
"A practical guide for the design of components that impact cooling tower thermal efficiency"
October 10, 2016
The importance of water in the cooling tower industry - Water (part 9)
HOW TO MEASURE THE EFFICIENCY OF A COOLING TOWER
In the design process of a cooling tower there is a need to have at least seven data values, or rather 7 variables. If only one of these values is changed, the result will be a cooling tower with different dimensions.
Some of this data or design values are questionable, such as the temperature of air at wet-bulb temperature, that seems to shift every year for speculation reasons.
To measure the efficiency of each tower, hence, there is a need to know the exact design data and the theory that allows to design the tower, knowing the values detected by lab effective testing.
All this will be treated in another chapter with interesting considerations.
Now we will discuss how to evaluate the efficiency of the cooling tower in a simple and practical way.
We shall use the method that will allow, at least, to compare the efficiency of the tower at the any given time with the efficiency of the tower at the time it was installed: in other words, the degradation of efficiency (if it exists).
The main element for cooling water is air. The amount of air is essential for the amount of heat to dissipate, temperature, etc.
The amount of air measurement is synonymous of tower efficiency.
The degradation over time can decrease the amount of air in the tower because there are occlusions within the filling material that block the passage of air. Occlusions may originate from collapsed material, limestone, dust, algae, etc.
The air will always circulate.
The masses of water and air inside the tower are huge. The water weight is about 15,000 to 30,000 kg/m2 of the tower. Thus, the water will always fall via preferential routes: holes or by laminating on the tower walls. The amount of air passing through the tower is of vital importance.
A quick way to know the efficiency of the cooling tower is to measure the amount of air all you need to is to measure the speed of the air incoming to the tower or outgoing from the tower.
The speed in m/s and is measured with an anemometer (a very simple tool with fan). This tool is used to measure the wind speed, etc. Hence, the speed through the cross section (m2 top view) of the tower MUST be between 2.5 and 4 m/s.
If the speed is lower than 2.5 m/s, the amount of air through the tower is very low and the cooling is compromised. The tower will be not efficient!
This method is basically a rule of thumb, but it serves as an alarm that a more accurate review is required.
September 26, 2016
The importance of water in the cooling tower industry - Water (part 7)
Process plants that can be cooled with evaporation systems.
The importance of disposing quantity of energy.
Efficiency of the cooling system.
The importance of disposing quantity of energy.
Efficiency of the cooling system.
Image from previous post "NERI Calculator". Click on the above image to learn more about the calculator. |
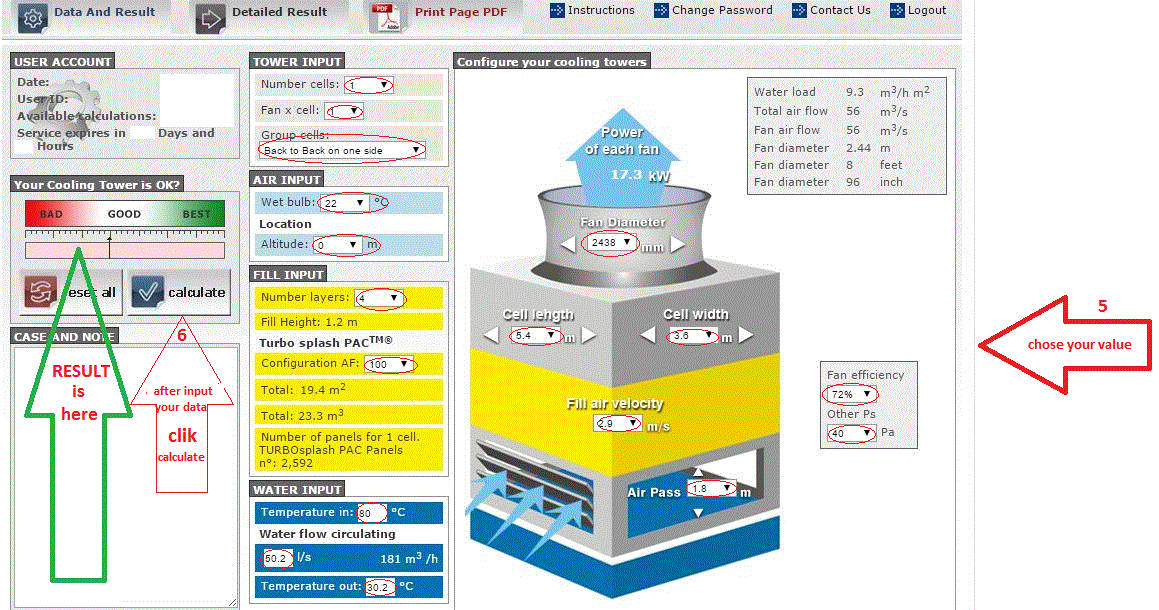
From what has been written on this subject, the disposal of heat from evaporative cooling towers use something in particular, that is, disposing large amounts of heat from the water by means of the air: two natural elements.
Heat disposal has, therefore, a relatively low cost.
To name a few examples where towers are used:
(a) disposing heat from the various refrigeration groups and city building air conditioning condensers.
(b) in industries such as oil refineries, chemical plants,
(c) in industrial process plants for the production of food products,
(d) in thermoelectric power plants,
(e) in geothermal systems.
(f) …
Obviously each type of installation has different requirements for heat disposal (amount of cooled water). Temperatures and their range must be designed appropriately and carefully, and, most of all, the air thermal characteristic data to be considered for cooling tower design.
Air data has to include temperature, humidity and altitude related to the location of the tower. These three values (temperature, humidity, altitude) are very important.
If the data is not chosen correctly, this can lead to the wrong tower sizing, up to three or four times higher, or lower, than the actual needs of the system.
If the tower sizing is higher than the correct value, this will lead to waste of material and, hence, higher cost of the system. On the other hand, if faulty sizing will lead to equipment that is not adequate to the system, hence, useless!
September 19, 2016
NERI Calculator
When it comes to evaporative water cooling towers, whether you're are part of the design team or maintenance operations, NERI Calculator helps ensure that the functionality of the tower is optimal and efficient, hence, maintaining plant's productivity at maximum level.
Design
Design
For maximum efficiency, in the design phase of the evaporative cooling tower project, NERI Calculator returns the optimal size of the tower needed to serve a predesigned plant system.
Maintenance
In normal maintenance operations, NERI Calculator verifies tower performance based on the actual tower data.
What are the risks of a poor functioning tower?
- Tower driven system will not function correctly
- Loss of productivity of the plant
- Could cause heavy damage
- Impact on the Environment
The cost of running a bad designed cooling tower could be high!
NERI Calculator covers two type of evaporative water cooling towers:
- Counter-flow: a water cooling tower design where the air-flow is directly opposite of the water-flow.
- Cross-flow: a water cooling tower system design in which the air-flow is directed perpendicular to the water-flow. Air flow enters one or more vertical faces of the cooling tower to meet the fill material.
If your tower is counter-flow, then try our NERI Calculator tool for free. When you sign up, we offer you a 1-day free trial of 50 calculations.
If your tower is cross-flow, then contact us and we'll do the calculations for you.
NERI Calculator is not only used for design purposes, but it's a tool to use always during on-going activities for monitoring and controlling cooling tower performance.
“Prevention is better than cure”
NERI Calculator will prevent damages resulting from a poorly functioning cooling tower, by verifying that the data is correct and/or has not been modified. Poor functioning cooling towers will have bad consequences not only on the cooling tower, but mostly on any production system served by the tower. All this damage and loss can be translated in huge economic loss!
How to use NERI Calculator:
STEP 1
Diagram 1 |
STEP 2
Diagram 2 |
STEP 3 AND 4
Diagram 3 |
STEP 5 AND 6
Diagram 4 |
FINAL DATA
Diagram 5 |
PRICE
Diagram 6 |
April 18, 2016
Cooling Tower Software
There are many design guideline to assist engineers to understand the basic principles of cooling towers. These towers are basically used to remove excess heat that is generated in places such as power stations, chemical plants and even domestically in air conditioning units, and are relatively inexpensive and a dependable means of removing low-grade heat from cooling water and have developed into an important part of a plant (and widely use in various plants). There are different types of cooling towers, air and water flow pattern.
Importantly in this field it the knowledge of theories relative to the physical characteristics of natural air and thermal characteristics of water in plants, before starting the design/sizing a cooling tower; moreover, for understanding its calculation (such as water make-up, fan characteristics).
After many years of Cooling Tower design and production, we want to share our experience with professionals in the field. We have developed a program, useful and easy to handle, for the quick and secure design and calculation of a cooling tower project.
The "Cooling Tower Software" program is based on these two flow patterns managed by the cooling tower.
This calculating program has three functions and it can be used for:
(i) designing a new project,
(ii) upgrading the performance of an existing counter flow tower, and
(iii) verifying the efficiency and working conditions of a tower.
In general, the program allows to know all accurate data related to cooling tower with different types of fill (splash or film) and, furthermore, optimize it for better performance.
Cooling towers tend to be clogged due to scale/limestone/algae, since it always has direct contact with the water and air. Hence, proper material selection or additional water treatment is then needed to keep the cooling tower running efficiently and safe.
Proper management is essential to maintain performance in order to prevent malfunctions and, as a consequence, drastic losses due to non-functionalities until it blocks the plant production.
In addition to the program, we have also developed a filling material for systems that exploit the physical principle of "mass transfer" to migrate from one element (water) to another (air), called TURBOsplash PAC ®™. This filling material is employed in water cooling towers, exploiting the two elements, water and air, to increase performance and allow for a reliable and long functioning period.
To see an example of the cooling tower software program result data, just click on the button below:
OR, to go directly to the calculating program website and try it out yourself, just click on this other button below:
April 11, 2016
Experimental Calculation verified with CFD (Computational Fluid Dynamics)
Approximately 20 years ago, before the commercialization of TURBOsplash PAC ®™, the product underwent a rigorous experimental testing and a CDF evaluation aimed for design work.
Since the geometry of TURBOsplash PAC ®™ was not comparable to other existing filling materials, the purpose of the analysis was to carry out a quantitative / qualitative evaluation of the pressure drop and relative efficiency subject to fluids (water and air) inside the cooling tower. A practical evaluation method was used experimentally, performed by independent laboratories that specialize in these of tests. The evaluation parameters, detected experimentally, were analyzed and verified using CFD programs at universities, with the aim to build or verify all cooling towers.
Hence, it was possible to obtain the air pressure drop and efficiency curves in the flow rate air or/and water change.
Numerical Set-Up (need for CFD calculations)
- Stationary type simulation
- Turbulence model: k-ε
- Solved equation:
- Continuity
- Moment of the quantity of motion
- Turbulent kinetic energy - turbulent dissipation
Boundary conditions
- Inlet Velocity [FPM]: {150, 300, 400, 500, 600}
- Outlet static pressure: 0 [Pa] (relative to environmental pressure equal to 101325 Pa)
Experimental / Numeric Comparison
Numerically, it was possible to reproduce the experimental data as overall trend and in terms of absolute value of the air pressure drop.
Air Velocity
![]() |
April 6, 2016
Appreciations for our blog
We like to thank everyone for visiting our blog and have shared our experience in Cooling Tower industry. Up to today, our blog "Cooling Tower", containing 84 posts, was seen approximately by 3000 visitors 7000 times, of which some visited the blog more than once.
March 28, 2016
Is a cooling tower a worthwhile investment? (part 3)
Now
let's see how we calculate the size of the tower with the
available data:
Let's
suppose that the water flow rate is 15 – 20 - 25 m3/ (m2
h), hence we have the size (top
view)
of the tower. We also have the market price and, hence, the
price of the tower.
For
the cost of fan power,
let's assume an air velocity of 3.5 m/s. We therefore know the air
flow rate to the fan and let's assume the yield value of the impeller
at 70%. It's now possible to calculate the power absorbed in kW that
will be useful to determine the fan power
cost.
Using
the same method we can also calculate the power absorbed by the pump
for the water circulation.
The
cost of the installation is calculated to be as much as the cost of
the tower.
Calculations
of the cost for the installation of a cooling tower
|
|
m2
tower (20 m3/h
m2 approx.)
|
1.26
|
Cost
of the tower
|
7,536,000
|
Cost
for installation
|
7.536,000
|
Total
cost
|
15,072,000
|
Calculation
of the cost for the power of the system with tower
|
|
Energy Consumed
|
|
motor
fan motor kW
|
1.05
|
air
flow rate
|
13,565
|
prevalence
mm CA
|
20
|
motorfan
yield
|
70%
|
pump
motor for the movement of water
|
5.42
|
water
flow rate
|
25,12
|
prevalence
m AC supply
|
30
|
yield
of the pump
|
70%
|
Total
kW for circuit tower kW / year
|
12,413
|
Cost
of electricity per year
|
1,241,281
|
Cost
for the make-up water calculated to 5%
m3
/ h
|
1.3
|
Cost
of make-up water
|
2,411,520
|
Cost
bleed-off water (= make-up / 2 x cost of water purge)
|
602,880
|
Cost
of maintenance of the tower 5% of the installation cost
|
753,600
|
Total
operative costs
|
2,597,761
|
Costs
Evaluation
|
|
Cost
with aqueduct water in one year
|
36,172,800
|
Operating
cost of the system with tower
|
2,597,761
|
Savings
in one year
|
33,575,039
|
Savings
each month
|
2,797,920
|
Total
cost of the tower
|
15,072,000
|
The
investment return (ROI) in MONTHS
|
5,4
|
Here
we can see that the ROI payback period for the tower installation is
only 5 and a half months. Because of the small entity involved,
financial costs were not taken into account.
All
of the above calculations are available upon request. For more
information contact us.
March 21, 2016
Is a cooling tower a worthwhile investment? (part 2)
Continuing from previous post on structuring the available data for calculations ...
So,
let's start with the following data:
Data
from within the company
|
|
Amount
of water from aqueduct m3/h
|
12,56
|
Hours
per day
|
8
|
Days
per week
|
5
|
Weeks
per year
|
48
|
Cost
of Water and Power
|
|
cost
primary water (1)x/m3
|
1000
|
cost
waste water (1)x/m3
|
500
|
cost
of kW / h
|
100
|
Calculation
of the cost of aqueduct water per year
|
|
Cost
of water used
|
|
Primary
aqueduct water m3/year
|
24,115,200
|
For
the waste water
|
12,057,600
|
Total
cost of water used in one year
|
36,172,800
|
Now
we will estimate the cost to design the system. If consists of:
- Cooling Tower
- Installation (materials included: pipes, valves, etc.)
- Cost of operation (maintenance, replenishing water energy)
Let's
now try to estimate the cost of the plant with the tower:
Suppose
that:
- the water flow in the tower is twice as much with respect to the system with water waste (the temperature difference between the incoming water and the outgoing water from the system will be about half)
Example:
Water
without cooling tower:
Actual
water flow rate: 30 m3/h
Inlet
temperature by the system: + 15 ° C
Outlet
temperature by the system: + 25 ° C
With
cooling tower:
Water
flow rate: 60 m3/h
In
worst weather condition: summer
Inlet
temperature by the system: + 30 ° C
Outlet
temperature by the system: + 35 ° C
Let's
suppose that the water flow rate is twice as much as the one used by
the plant with aqueduct water (the difference in temperature between
the water entering the system will be about half from the one exiting
the system).
Another
thing to decide about a plant with cooling tower
is:
- high efficiency (the water temperature leaving the tower to serve the system)
- medium efficiency
- to dispose only heat from users (water temperature leaving the cooling tower is not important)
We
can now combine all the above data because we have sufficient
elements to determine the physical size of the tower. To make a cost
estimation, keep in mind that the market price of a tower of the size
around 1 m2 is 6,000,000
(1)x
.
Obviously
the bigger towers cost less relative to size.
Other
elements to evaluate are: induced draft cooling towers with forced
ventilation; centrifugal fans, axial fans, built in galvanized steel,
stainless steel, polyester reinforced with glass fiber.
(We
should consider all tangible items that are now part of our
designer's skills).
In
the next article “Is a cooling tower a worthwile investment? (part
3)”, we shall see how to calculate the size of the tower with the
above available data.
(1)X is an hypothetical cost unit.
Subscribe to:
Posts (Atom)